Key findings:
- Virginia 14th worst driving state in 2018.
- Richmond and Virginia Beach each top 10 worst driving cities in America.
- 8th most distracted drivers in the nation.
- 10% of roads in poor condition costing Virginia drivers $430 annually
Ever wonder if the bad drivers around you are really the worst? We wanted to give Virginia drivers a full view of how bad drivers really are. To be fair Virginia drivers aren’t the worst, just pretty bad. All the factors we evaluated for the Virginia driver grade came from over 102,000 insurance quotes from users of QuoteWizard.com. Along with data from the Federal Highway Administration (FHA) and the National Association of Insurance Commissioners (NAIC) to score Virginia drivers. Factors in the driver report are based on the following:
- Driver quality in cities
- Distracted drivers
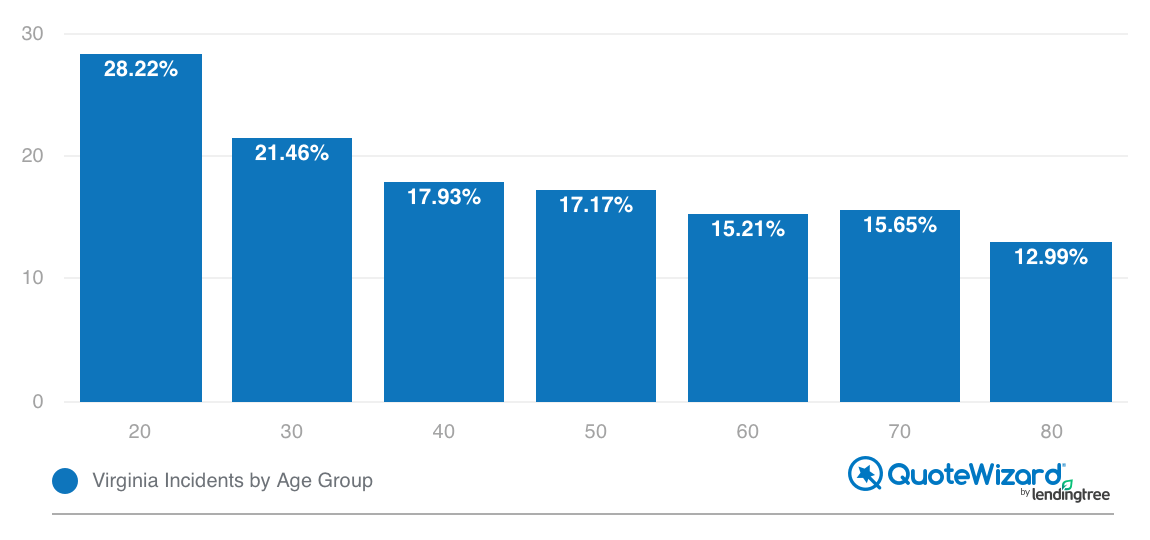
- Driver quality by age group
- Road infrastructure
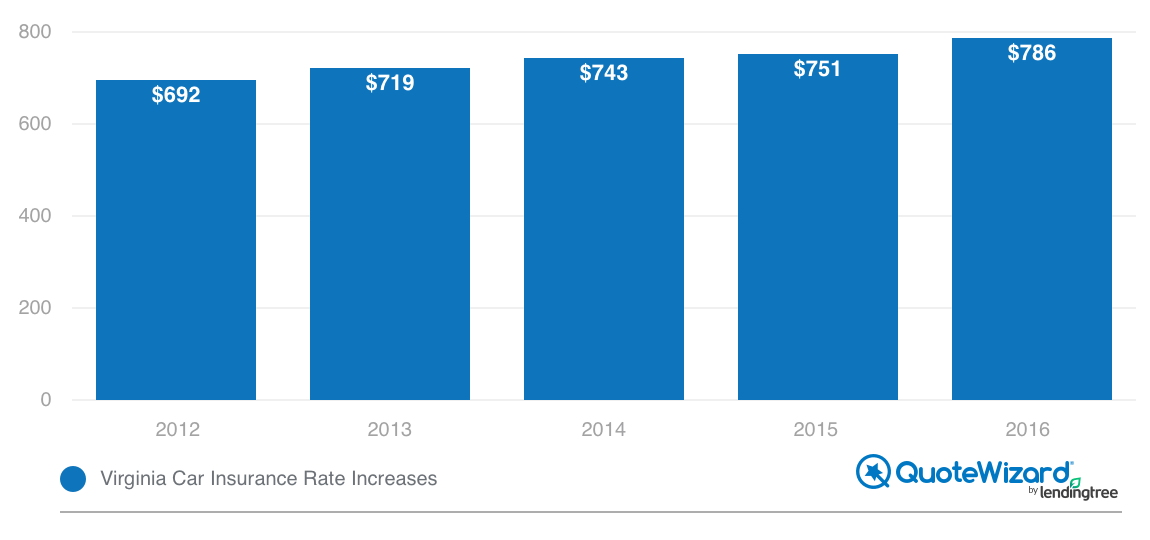
- Car insurance increases
Virginia driver grade: D. The only thing saving Virginia from a failing grade was the improvement in overall driving ranking since 2016. In 2016 Virginia was the 3rd worst driving state from the QuoteWizard best and worst driving state study. In 2018 Virginia drivers improved to 14th worst. Still not great. In our most recent best and worst driving city study, Virginia Beach and Richmond were each top 10 worst driving cities in the nation. Virginia Beach came in at 3rd worst and Richmond 10th worst. To top it all off Virginia came in at 8th most distracted driving state. Bad scores all around lead to the D grade, but improvements overall kept it above an F.
Best and worst drivers in Virginia
When we here at QuoteWizard analyze the best and worst driving cites in each states there seems to be common factors beyond just good and bad drivers that lead to more incidents. We typically see the bad driving cities location in suburban cities that deal with traffic in and out of the big city. Manassas is a typical fit for bad driving. Right outside of the DC metro area you’d find a lot of traffic in and out of Manassas. Still not an excuse for the drivers there.
In the best driving cities you’ll typically find them outside of the metro areas and in more rural places. Rocky Mount and Blacksburg each have those characteristics. Less cars on the road means less chance of an incident. Kudos to the college kids at Virginia Tech in Blacksburg for holding up their end of the good driving.
To determine overall driver quality in Virginia, we analyzed driver quality in the states 50 largest cities who used QuoteWizard.com to compare quotes. We then ranked the worst 10 and best 10 cities by the highest rate of incidents. Incidents include accidents, speeding tickets, DUIs and moving citations from that data. Cities with the highest rate of incidents were listed as the worst driving cities.
Worst driving cities in Virginia
| Rank (worst) | City |
|---|---|
| 1 | Manassas |
| 2 | Salem |
| 3 | Staunton |
| 4 | Woodbridge |
| 5 | Chesterfield |
| 6 | Fairfax |
| 7 | Petersburg |
| 8 | Stafford |
| 9 | Front Royal |
| 10 | Midlothian |
Best driving cities in Virginia
| Rank (best) | City |
|---|---|
| 1 | Rocky Mount |
| 2 | Glen Allen |
| 3 | Blacksburg |
| 4 | Harrisonburg |
| 5 | Lynchburg |
| 6 | Bristol |
| 7 | Sterling |
| 8 | Arlington |
| 9 | Portsmouth |
| 10 | Ashburn |
Virginia infrastructure rating
Over the summer QuoteWizard conducted a study on America’s infrastructure and which states had the best and worst roads. We analyzed FHA data to rank states on road and bridge quality and found Virginia to be the 15th best for overall infrastructure. Rankings were a composite score of the following factors:
- Roads in poor condition (%): Virginia 10%
- Cost per motorist (due to roads in need of repair): Virginia $430
- Bridges structurally deficient (%): Virginia 5%
Virginia actually fared very well compared to other states infrastructure. The 10% of roads in poor condition was among the lowest in the country. Only 5% of bridges and the lower comparative cost to drivers of $430 was also among the lowest in the nation. The only thing to take note of is the 19% spending on highway maintenance is below the national average, but given the low percentage of poor roads Virginia drivers should be okay.
Best and worst drivers by age group
Another typical trend we see in other states is how the younger age groups are statistically the worst drivers. Of course you would expect 20 year olds to have the most incidents on their record. Insurance companies take note of these trends too when setting rates. Which is why insurance rates typically go down the older you get. More experience behind the wheel leads to less incidents.

Most popular vehicles by age group
Millennials are of the age where wealth is not grown to the figures of their older counterparts. That’s why most millennials are driving cheaper cars. Gen X and baby boomers vehicle choice is popular with Ford F-150 trucks which are on the higher end of the price scale compared to millennial cars. While millennials are driving cheaper cars, it very well could be they depend on a car less and therefore don’t spend money on nicer cars. Public transportation and ridesharing like Uber are becoming a more popular means of transportation.
Millennials (23-38)
Average MSRP $21,993
| Most popular | Model | MSRP |
|---|---|---|
| 1 | Accord | $23,870 |
| 2 | Altima | $24,100 |
| 3 | Camry | $24,295 |
| 4 | Civic | $19,750 |
| 5 | Focus | $17,950 |
Gen X (39-54)
Average MSRP $23,730
| Most popular | Model | MSRP |
|---|---|---|
| 1 | Altima | $24,100 |
| 2 | F-150 | $28,495 |
| 3 | Camry | $24,295 |
| 4 | Accord | $23,870 |
| 5 | Sentra | $17,890 |
Baby boomers (55-75)
Average MSRP $21,902
| Most popular | Model | MSRP |
|---|---|---|
| 1 | F-150 | $28,495 |
| 2 | Camry | $24,295 |
| 3 | Versa | $14,730 |
| 4 | Altima | $24,100 |
| 5 | Sentra | $17,890 |
Car insurance getting more expensive in Virginia
If you think car insurance is always getting more expensive, you’re right, it is. Since 2012 Virginia drivers have seen a 14% increase in car insurance rates. The increase is right on par with the national average. However, the $786 annual average is well below the national average so Virginia drivers consider themselves lucky to drive in the state.

QuoteWizard.com LLC has made every effort to ensure that the information on this site is correct, but we cannot guarantee that it is free of inaccuracies, errors, or omissions. All content and services provided on or through this site are provided "as is" and "as available" for use. QuoteWizard.com LLC makes no representations or warranties of any kind, express or implied, as to the operation of this site or to the information, content, materials, or products included on this site. You expressly agree that your use of this site is at your sole risk.