Despite unemployment falling 0.9% to 10.2% in July 2020, there are still over 16 million unemployed Americans. One of the most significant impacts of unemployment is the resulting number of people who will also lose their employer-sponsored health insurance. While some unemployed can seek Medicaid or other means of health insurance, many are left without viable or affordable health insurance options. It’s estimated that between February and May, pandemic-related job loss led to 5.4 million people becoming uninsured. Estimations by the Robert Wood Johnson Foundation predict a total of 10 million people could be left uninsured by December 2020.
Key findings:
- An estimated 5.4 million people from February to May are left uninsured as a result of job losses.
- The Robert Wood Johnson Foundation predicts over 10 million people will lose employer-sponsored health insurance by the end of 2020 as a result of pandemic-related job loss
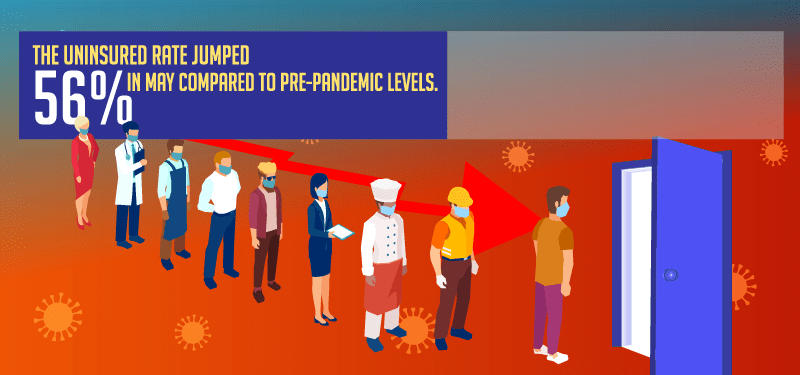
- The uninsured rate jumped 56% in May compared to pre-pandemic levels.
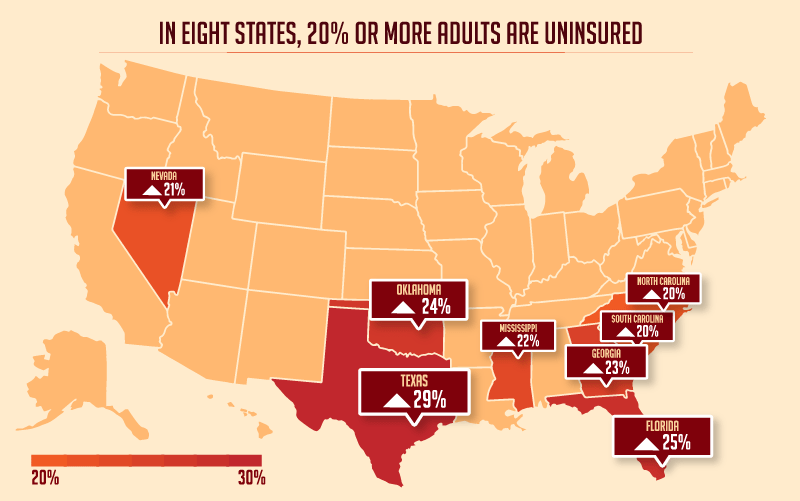
- In eight states, 20% or more adults are uninsured.
- States with high unemployment experienced the largest increases in uninsured rates.
Unemployment and uninsured rates are closely correlated. While not a one-to-one direct correlation, unemployment will result in people losing health insurance. We here at QuoteWizard analyzed unemployment and health insurance data from Kaiser Family Foundation to illustrate how unemployment rates impact health insurance rates.

We compared uninsured rates in each state before and during the COVID-19 pandemic to show which states saw the largest increases in uninsured rates. We then paired that data with June unemployment rates in each state. Rankings for each state are based on the growth of uninsured rates before and during the pandemic. Massachusetts, Hawaii and Michigan experienced the highest growth in uninsured rates during the pandemic, with rates increasing by over 140%.
| Rank | State | Unemployment Rate | May Uninsured Rate | Increase in Uninsured Rate |
|---|---|---|---|---|
| 1 | Massachusetts | 17.4% | 8% | 167% |
| 2 | Hawaii | 13.9% | 10% | 150% |
| 3 | Michigan | 14.8% | 12% | 140% |
| 4 | Rhode Island | 12.4% | 9% | 125% |
| 5 | New Hampshire | 11.8% | 11% | 120% |
| 6 | New York | 15.7% | 10% | 100% |
| 7 | West Virginia | 10.4% | 12% | 100% |
| 8 | Connecticut | 9.8% | 10% | 100% |
| 9 | South Carolina | 8.7% | 20% | 100% |
| 10 | Minnesota | 8.6% | 8% | 100% |
| 11 | Florida | 10.4% | 25% | 92% |
| 12 | Nevada | 15.0% | 21% | 91% |
| 13 | Tennessee | 9.7% | 19% | 90% |
| 14 | Alabama | 7.5% | 19% | 90% |
| 15 | Missouri | 7.9% | 17% | 89% |
| 16 | Arkansas | 8.0% | 15% | 88% |
| 17 | New Jersey | 16.6% | 13% | 86% |
| 18 | California | 14.9% | 13% | 86% |
| 19 | Illinois | 14.6% | 13% | 86% |
| 20 | Oregon | 11.2% | 13% | 86% |
| 21 | Delaware | 12.5% | 11% | 83% |
| 22 | Ohio | 10.9% | 11% | 83% |
| 23 | Mississippi | 8.7% | >22% | 83% |
| 24 | Maryland | 8.0% | 11% | 83% |
| 25 | North Carolina | 7.6% | 20% | 82% |
| 26 | Iowa | 8.0% | 9% | 80% |
| 27 | New Mexico | 8.3% | 16% | 78% |
| 28 | South Dakota | 7.2% | 16% | 78% |
| 29 | Louisiana | 9.7% | 14% | 75% |
| 30 | Vermont | 9.4% | 7% | 75% |
| 31 | Washington | 9.8% | 12% | 71% |
| 32 | Oklahoma | 6.6% | 24% | 71% |
| 33 | Pennsylvania | 13.0% | 10% | 67% |
| 34 | Wisconsin | 8.5% | 10% | 67% |
| 35 | Kentucky | 4.3% | 10% | 67% |
| 36 | Kansas | 7.5% | 15% | 67% |
| 37 | Georgia | 7.6% | 23% | 64% |
| 38 | Idaho | 5.6% | 18% | 64% |
| 39 | Indiana | 11.2% | 13% | 63% |
| 40 | Colorado | 10.5% | 13% | 63% |
| 41 | Montana | 7.1% | 13% | 63% |
| 42 | Maine | 6.6% | 13% | 63% |
| 43 | Texas | 8.6% | 29% | 61% |
| 44 | Virginia | 8.4% | 14% | 56% |
| 45 | Arizona | 10.0% | 17% | 55% |
| 46 | Wyoming | 7.6% | 17% | 55% |
| 47 | Nebraska | 6.7% | 12% | 50% |
| 48 | Utah | 5.1% | 13% | 44% |
| 49 | Alaska | 12.4% | 17% | 42% |
| 50 | North Dakota | 6.1% | 11% | 38% |
The correlation illustrated with these rankings shows just how impactful unemployment rates are on uninsured rates. Most states experiencing high rates of unemployment are those seeing the largest increases in uninsured rates. Massachusetts experienced a nation-high 17.4% unemployment rate and the largest increase in uninsured rates. However, at an 8% uninsured rate, Massachusetts actually has one of the lowest levels of uninsured people in the country. Even with large increases in unemployment in states like Massachusetts, New York and Michigan still have low uninsured rates compared to other states.

States arguably hit hardest are those with already-high levels of uninsured rates prior to the pandemic and large growth in uninsured rates during the pandemic. Florida, Nevada and South Carolina are states with already-high uninsured rates prior to the pandemic that saw significant growth in uninsured numbers. Florida, one of the largest states by population, saw uninsured rates nearly double in what could be the state hit hardest by the total number of people becoming uninsured.
Methodology
QuoteWizard analyzed Bureau of Labor Statistics unemployment data from June 2020, and paired it with May 2020 uninsured data from the Kaiser Family Foundation and Families USA to see which states saw the greatest impacts from unemployment on uninsured rates during the COVID-19 pandemic. Rankings are based on a change in uninsured rates from 2018 to May 2020. States that saw the largest increases in uninsured rates from 2018 to May 2020 were also states that had the highest unemployment rates in June 2020.
References:
QuoteWizard.com LLC has made every effort to ensure that the information on this site is correct, but we cannot guarantee that it is free of inaccuracies, errors, or omissions. All content and services provided on or through this site are provided "as is" and "as available" for use. QuoteWizard.com LLC makes no representations or warranties of any kind, express or implied, as to the operation of this site or to the information, content, materials, or products included on this site. You expressly agree that your use of this site is at your sole risk.