Coronavirus cases are rising, and flu season is in full swing. Vaccines are a key means of protection, but nearly half of the nation’s school-age children aren’t protected. Our team of analysts found that nationwide, 57% of children under 17 haven’t received the coronavirus vaccine and 55% haven’t gotten a flu shot.
Key findings:
- Vaccination rates are highest among older children and in the northeast and western parts of the country.
- Rhode Island, Massachusetts and Connecticut have the highest vaccination rates.
- Wyoming, Mississippi and Tennessee have the lowest vaccination rates.
- 41 million children haven’t received a coronavirus vaccine, and 39 million have not gotten a flu shot.
Vaccination rates for the coronavirus and the flu vary significantly by both age and location. Older children (12-17 years old) are more likely to be vaccinated than younger children, and people living in the northeast and western parts of the country are more likely to be vaccinated than people living in the South and the Midwest.
Nationwide, nearly 41 million children under the age of 17 haven’t received the coronavirus vaccine and 39 million haven’t gotten a flu shot. Rhode Island, Massachusetts and Connecticut have the highest vaccination rates. Wyoming, Mississippi and Tennessee have the lowest vaccination rates.
| State | Overall vaccination rank | % of children with COVID-19 vaccine | % of children with flu vaccine |
|---|---|---|---|
| Rhode Island | 1 | 80% | 79% |
| Massachusetts | 2 | 82% | 56% |
| Connecticut | 3 | 75% | 60% |
| Virginia | 4 | 67% | 53% |
| Colorado | 5 | 60% | 60% |
| New Jersey | 6 | 63% | 55% |
| Maryland | 7 | 70% | 49% |
| Vermont | 8 | 79% | 47% |
| Washington | 9 | 59% | 51% |
| California | 10 | 64% | 48% |
| New Hampshire | 11 | 57% | 49% |
| Hawaii | 12 | 72% | 46% |
| Texas | 13 | 57% | 51% |
| Illinois | 14 | 59% | 48% |
| New York | 15 | 64% | 46% |
| Minnesota | 16 | 56% | 48% |
| North Carolina | 17 | 54% | 49% |
| New Mexico | 18 | 66% | 44% |
| Kansas | 19 | 48% | 50% |
| Pennsylvania | 20 | 57% | 46% |
| Maine | 21 | 64% | 41% |
| Utah | 22 | 52% | 46% |
| Nebraska | 23 | 47% | 48% |
| Iowa | 24 | 42% | 48% |
| Wisconsin | 25 | 48% | 44% |
| South Dakota | 26 | 50% | 42% |
| Missouri | 27 | 40% | 46% |
| Arkansas | 28 | 41% | 46% |
| Arizona | 29 | 57% | 34% |
| Florida | 30 | 47% | 40% |
| Oregon | 31 | 57% | 34% |
| Georgia | 32 | 39% | 46% |
| Delaware | 33 | 56% | 35% |
| South Carolina | 34 | 40% | 44% |
| Michigan | 35 | 42% | 38% |
| Alaska | 36 | 49% | 35% |
| West Virginia | 37 | 35% | 46% |
| North Dakota | 38 | 39% | 37% |
| Indiana | 39 | 38% | 39% |
| Idaho | 40 | 32% | 44% |
| Ohio | 41 | 39% | 36% |
| Montana | 42 | 39% | 36% |
| Oklahoma | 43 | 39% | 37% |
| Nevada | 44 | 45% | 30% |
| Kentucky | 45 | 38% | 35% |
| Louisiana | 46 | 33% | 36% |
| Alabama | 47 | 30% | 37% |
| Tennessee | 48 | 33% | 32% |
| Mississippi | 49 | 32% | 27% |
| Wyoming | 50 | 30% | 29% |
| United States | 43% | 45% |
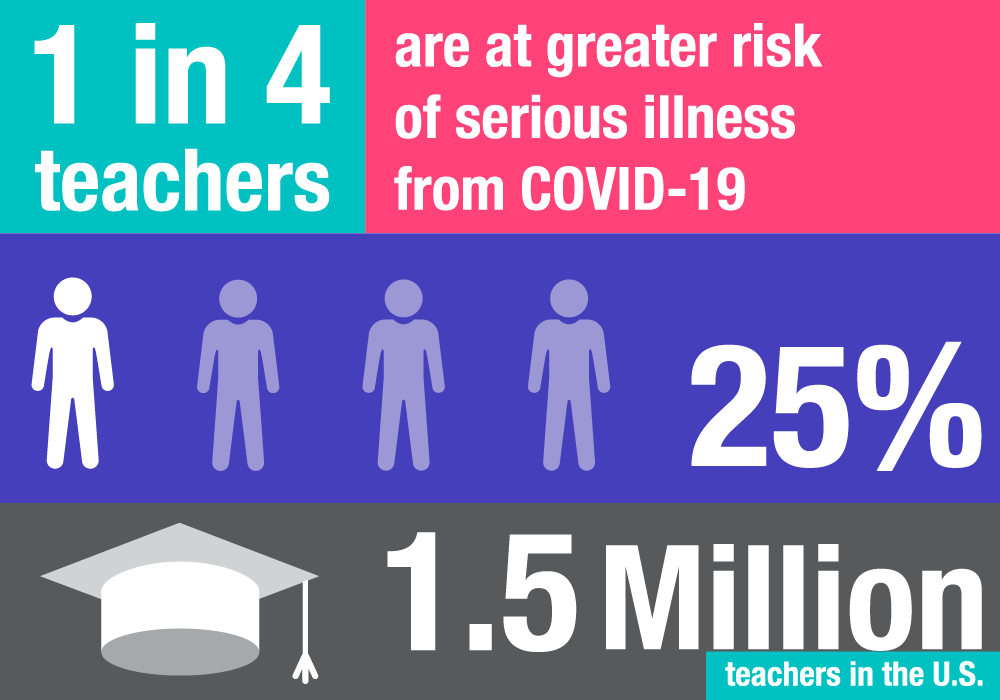
When people aren’t vaccinated, they expose those around them to additional risks, especially those with underlying health conditions. The Kaiser Family Foundation estimates that nearly 1.5 million teachers (1 in 4) are at a greater risk of serious illness from COVID-19 because of preexisting conditions like diabetes, asthma and heart disease.

Coronavirus vaccinations by state
The number of school-age children vaccinated against the coronavirus varies between 30% and 82% depending on the state. Wyoming, Alabama and Idaho have the lowest coronavirus vaccination rates, while Massachusetts, Rhode Island and Vermont have the highest.
| State | % of children vaccinated (5-12) | % of children vaccinated (12-17) |
|---|---|---|
| Alabama | 17% | 43% |
| Alaska | 35% | 63% |
| Arizona | 41% | 73% |
| Arkansas | 26% | 56% |
| California | 47% | 81% |
| Colorado | 46% | 73% |
| Connecticut | 56% | 93% |
| Delaware | 40% | 71% |
| Florida | 28% | 66% |
| Georgia | 25% | 53% |
| Hawaii | 52% | 92% |
| Idaho | 21% | 42% |
| Illinois | 47% | 71% |
| Indiana | 27% | 48% |
| Iowa | 31% | 53% |
| Kansas | 34% | 61% |
| Kentucky | 25% | 50% |
| Louisiana | 19% | 47% |
| Maine | 52% | 76% |
| Maryland | 54% | 86% |
| Massachusetts | 67% | 97% |
| Michigan | 32% | 52% |
| Minnesota | 47% | 65% |
| Mississippi | 18% | 46% |
| Missouri | 28% | 52% |
| Montana | 28% | 49% |
| Nebraska | 35% | 59% |
| Nevada | 27% | 63% |
| New Hampshire | 42% | 71% |
| New Jersey | 46% | 80% |
| New Mexico | 50% | 82% |
| New York | 46% | 82% |
| North Carolina | 38% | 69% |
| North Dakota | 28% | 49% |
| Ohio | 29% | 49% |
| Oklahoma | 22% | 55% |
| Oregon | 44% | 69% |
| Pennsylvania | 43% | 70% |
| Rhode Island | 64% | 95% |
| South Carolina | 26% | 53% |
| South Dakota | 36% | 63% |
| Tennessee | 21% | 45% |
| Texas | 40% | 73% |
| Utah | 38% | 65% |
| Vermont | 69% | 88% |
| Virginia | 52% | 82% |
| Washington | 45% | 73% |
| West Virginia | 21% | 49% |
| Wisconsin | 37% | 59% |
| Wyoming | 19% | 40% |
Child flu vaccination rate by state
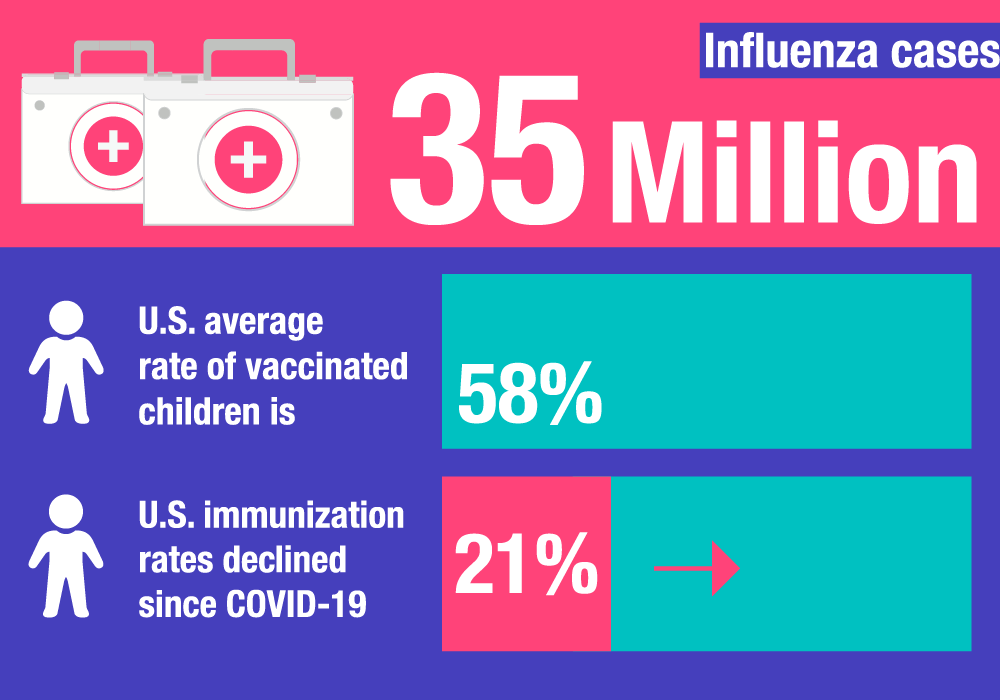
During the height of the coronavirus pandemic, flu vaccination rates dropped by 21% nationwide. However, now that lockdowns have been lifted and medical services are increasingly available, flu vaccination rates are returning closer to traditional averages.

Flu vaccination rates for children under the age of 17 vary between 27% and 79% depending on the state. Rhode Island, Colorado and Connecticut have the highest flu vaccination rates. Mississippi, Wyoming and Nevada have the lowest flu vaccination rates among children.
| State | % of children who received a flu vaccine |
|---|---|
| Alabama | 30% |
| Alaska | 49% |
| Arizona | 57% |
| Arkansas | 41% |
| California | 64% |
| Colorado | 60% |
| Connecticut | 75% |
| Delaware | 56% |
| Florida | 47% |
| Georgia | 39% |
| Hawaii | 72% |
| Idaho | 32% |
| Illinois | 59% |
| Indiana | 38% |
| Iowa | 42% |
| Kansas | 48% |
| Kentucky | 38% |
| Louisiana | 33% |
| Maine | 64% |
| Maryland | 70% |
| Massachusetts | 82% |
| Michigan | 42% |
| Minnesota | 56% |
| Mississippi | 32% |
| Missouri | 40% |
| Montana | 39% |
| Nebraska | 47% |
| Nevada | 45% |
| New Hampshire | 57% |
| New Jersey | 63% |
| New Mexico | 66% |
| New York | 64% |
| North Carolina | 54% |
| North Dakota | 39% |
| Ohio | 39% |
| Oklahoma | 39% |
| Oregon | 57% |
| Pennsylvania | 57% |
| Rhode Island | 80% |
| South Carolina | 40% |
| South Dakota | 50% |
| Tennessee | 33% |
| Texas | 57% |
| Utah | 52% |
| Vermont | 79% |
| Virginia | 67% |
| Washington | 59% |
| West Virginia | 35% |
| Wisconsin | 48% |
| Wyoming | 30% |
Methodology
QuoteWizard compiled data from the Centers for Disease Control and Prevention and the American Academy of Pediatrics to determine coronavirus and flu vaccination rates in each state. Data was compiled in the last week of December 2022. QuoteWizard used a composite score of both flu and coronavirus vaccination rates to determine each state’s overall vaccination rate.
References:
QuoteWizard.com LLC has made every effort to ensure that the information on this site is correct, but we cannot guarantee that it is free of inaccuracies, errors, or omissions. All content and services provided on or through this site are provided "as is" and "as available" for use. QuoteWizard.com LLC makes no representations or warranties of any kind, express or implied, as to the operation of this site or to the information, content, materials, or products included on this site. You expressly agree that your use of this site is at your sole risk.
